Monq® – корпоративный ИТ-мониторинг
нового поколения
Мониторинг инфраструктуры, оборудования, приложений, сервисов, пользовательских интерфейсов и зонтичный мониторинг – всё в одной платформе на low и no-code автоматизации
Внешние источники данных
Подключение внешних источников данных – систем мониторинга, логирования и сбора метрик. Готовые контент-паки Zabbix, Kubernetes и др.
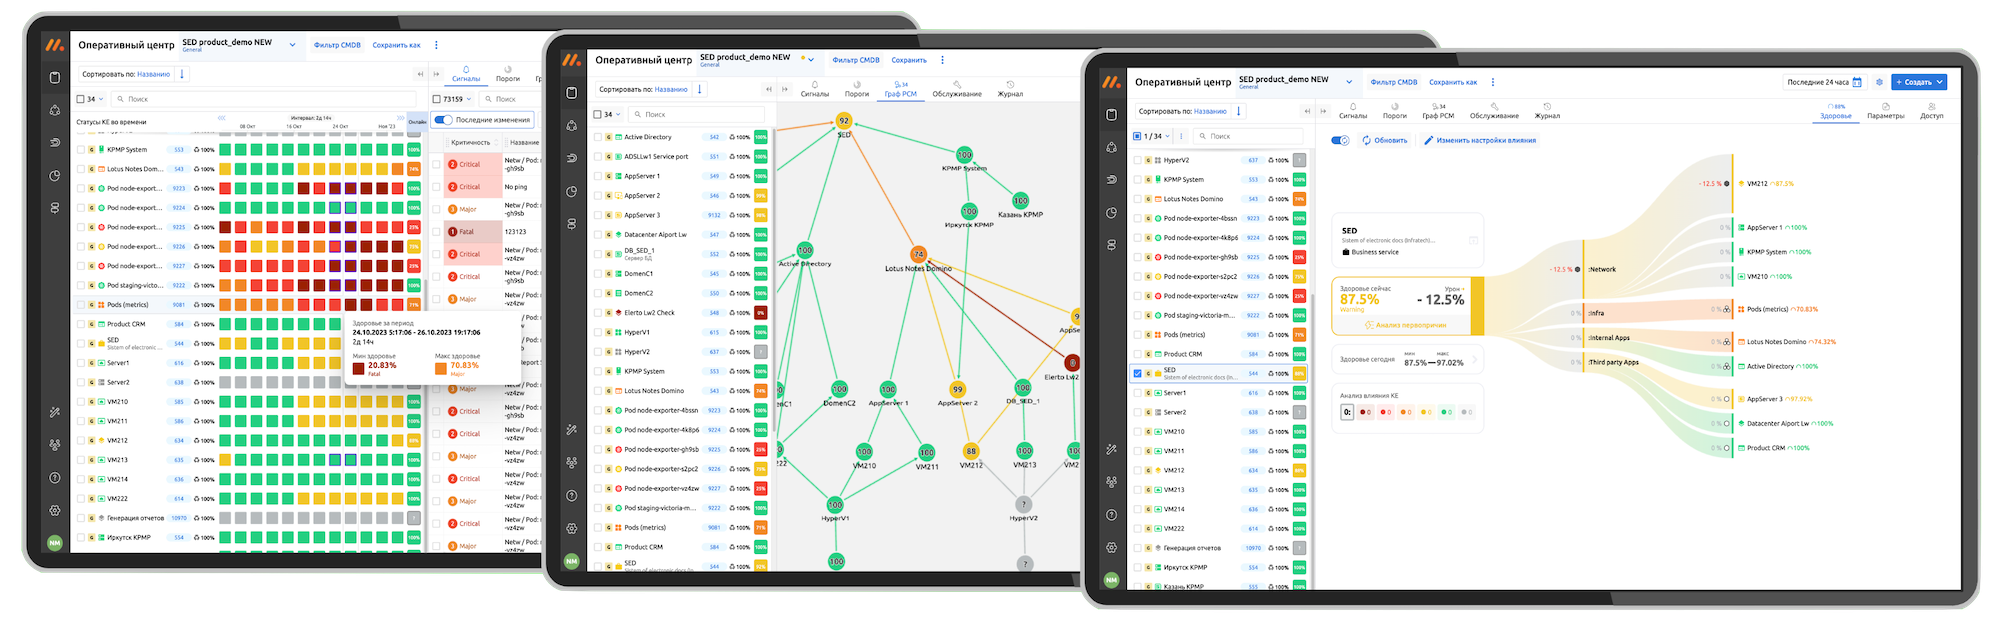
Оперативный центр
Единое окно за наблюдением всего ИТ-окружения. Покрытие мониторингом конфигурационных единиц.
Ресурсно-сервисная модель
Формирование собственной ресурсно-сервисной модели ИТ-окружения, в том числе и в автоматическом режиме.
Визуальный движок программирования low-code
Создание сценариев автоматизации обработки событий и метрик.
No-code бизнес-процессы эксплуатации
Инструмент автоматизации от простых пользовательских действий до сложных, распределенных по времени пользовательских процессов. Автоматизация регламентных действий.
Дедупликация и корреляция
Автоматизация работы со «штормом алертов». Дедупликация входящих сообщений и работа с группами событий.
Расчёт здоровья ИС
Наблюдение за здоровьем объектов РСМ и просчёт влияния здоровья дочерних объектов на родительские. Управление сервисными режимами – периодами игнорирования событий.
Синтетический мониторинг
Проверки бизнес-процессов и непрерывное тестирование интерфейсов с помощью машинного зрения.
Алертинг и автоэскалация
Автореагирование на формирование интегральных событий с помощью выполнения скриптов, оповещений, управлением инцидентами в Service Desk.
Отчеты
Предоставление отчетности в различном виде, включая отчеты SLA.
Ролевая модель
Рабочие группы и управление доступами. Работа в контексте рабочей группы.
Интеграции
Интеграция с системами Service Desk и синхронизации РСМ с CMDB.